


Project Description
Real User Monitoring (RUM) service tells the story of your website’s performance from the perspective of the people who use it.
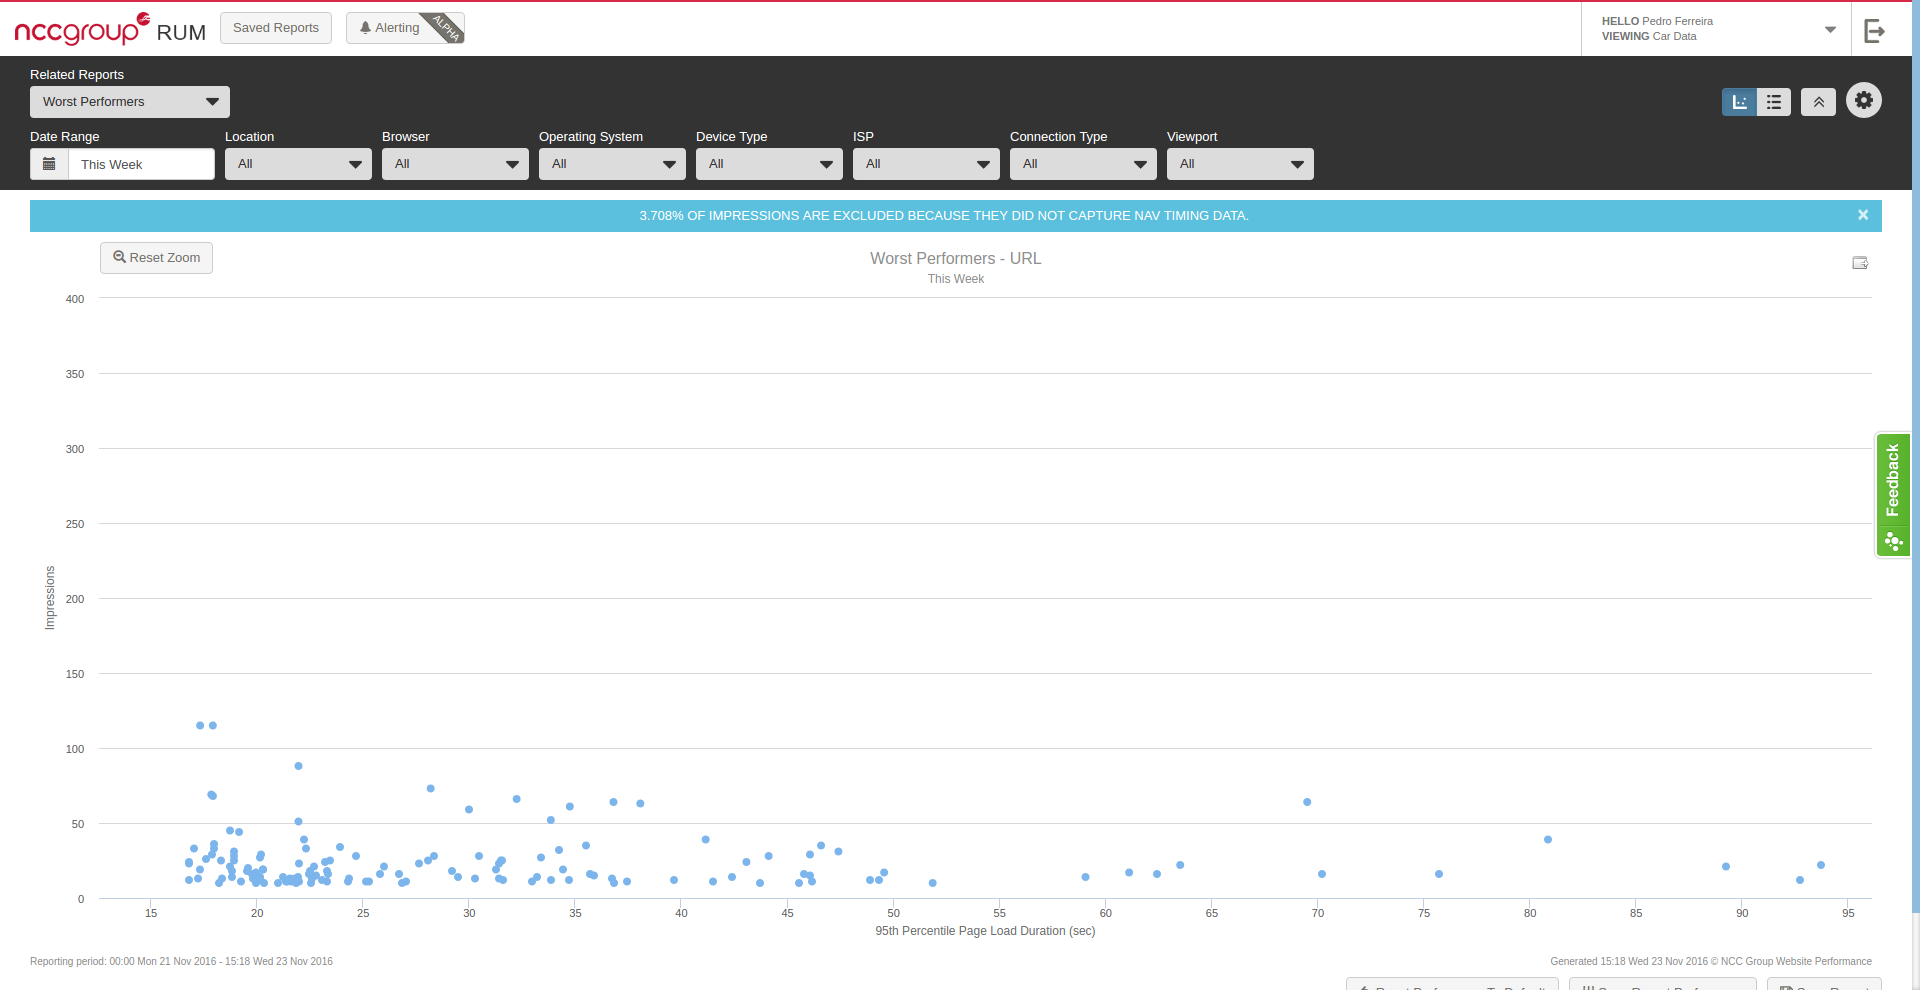
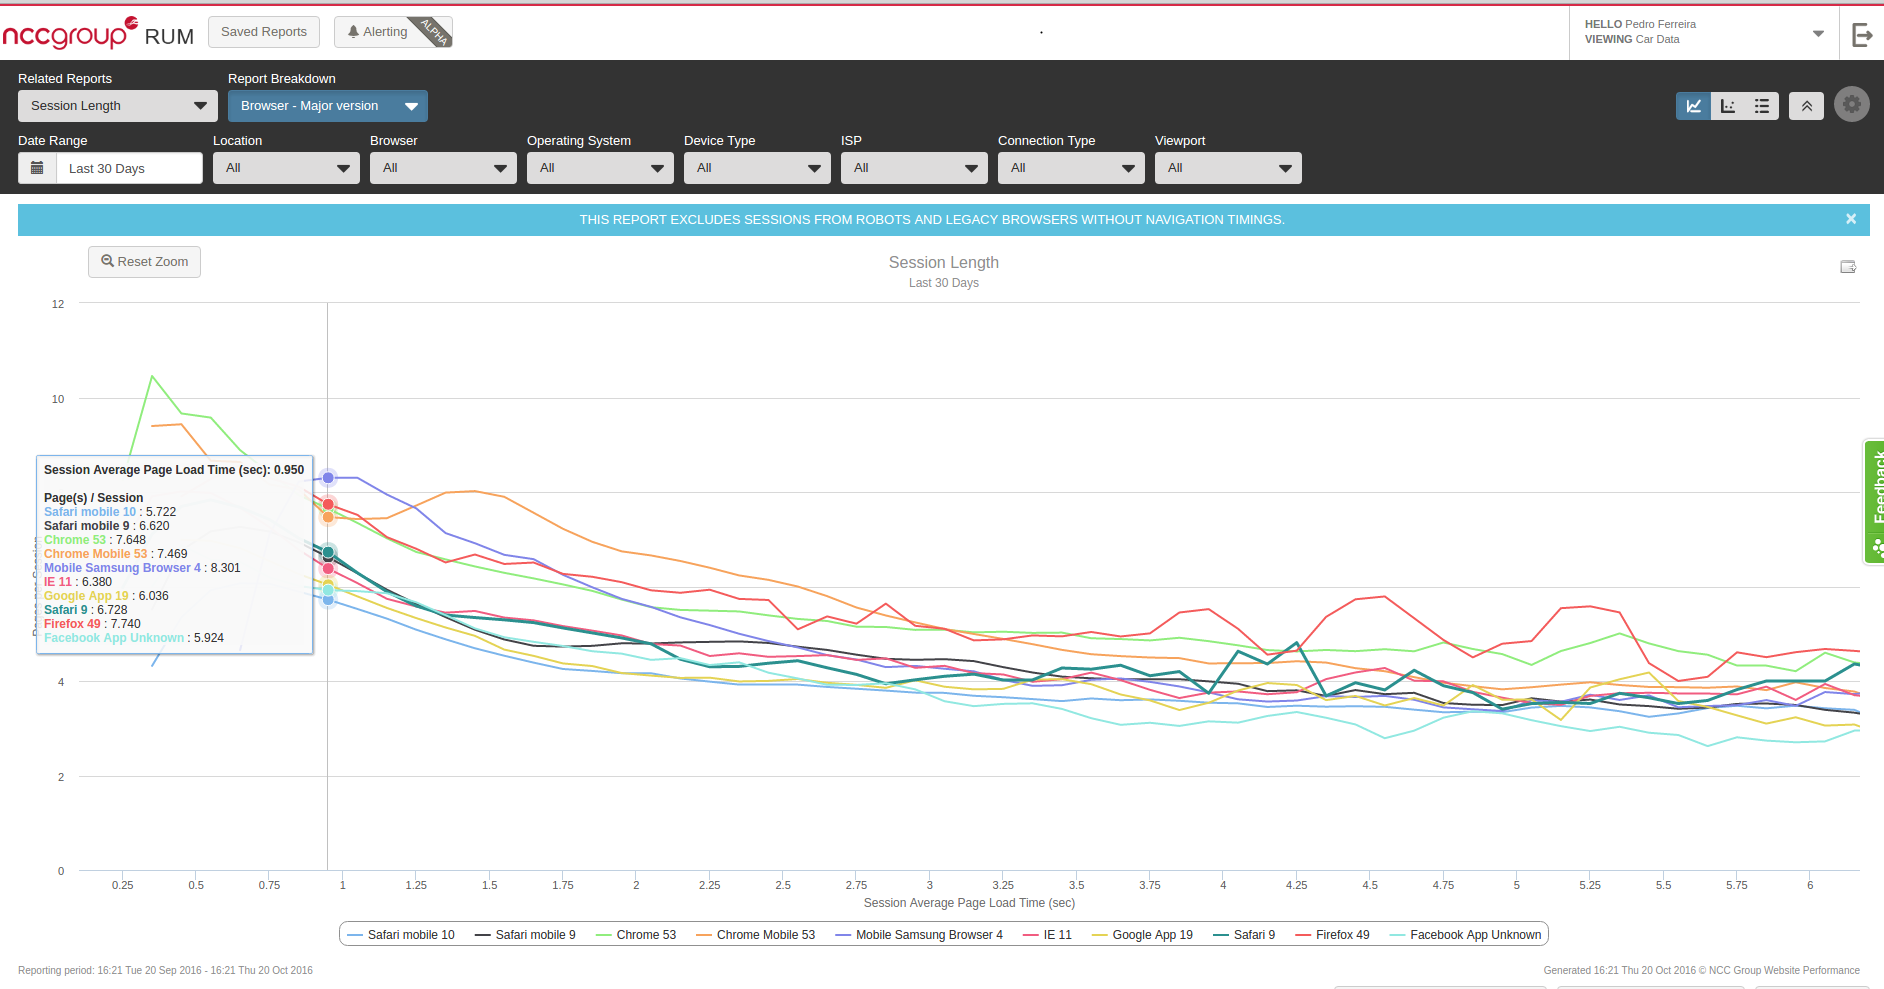
RUM tracks every visit to every page on a customer’s site and reports on how that site performed for that user. It captures live session data and pushes it to an online interface for review in real time, allowing for the interrogation of large volumes of data to easily discover things like:
- the slowest performing pages across the entire site;
- how performance relates to factors such as:
- which visitors are seeing the worst performance;
- whether CDN is delivering the performance value it should;
- where to focus development efforts and infrastructure investment.
The project is composed of several components, which include:
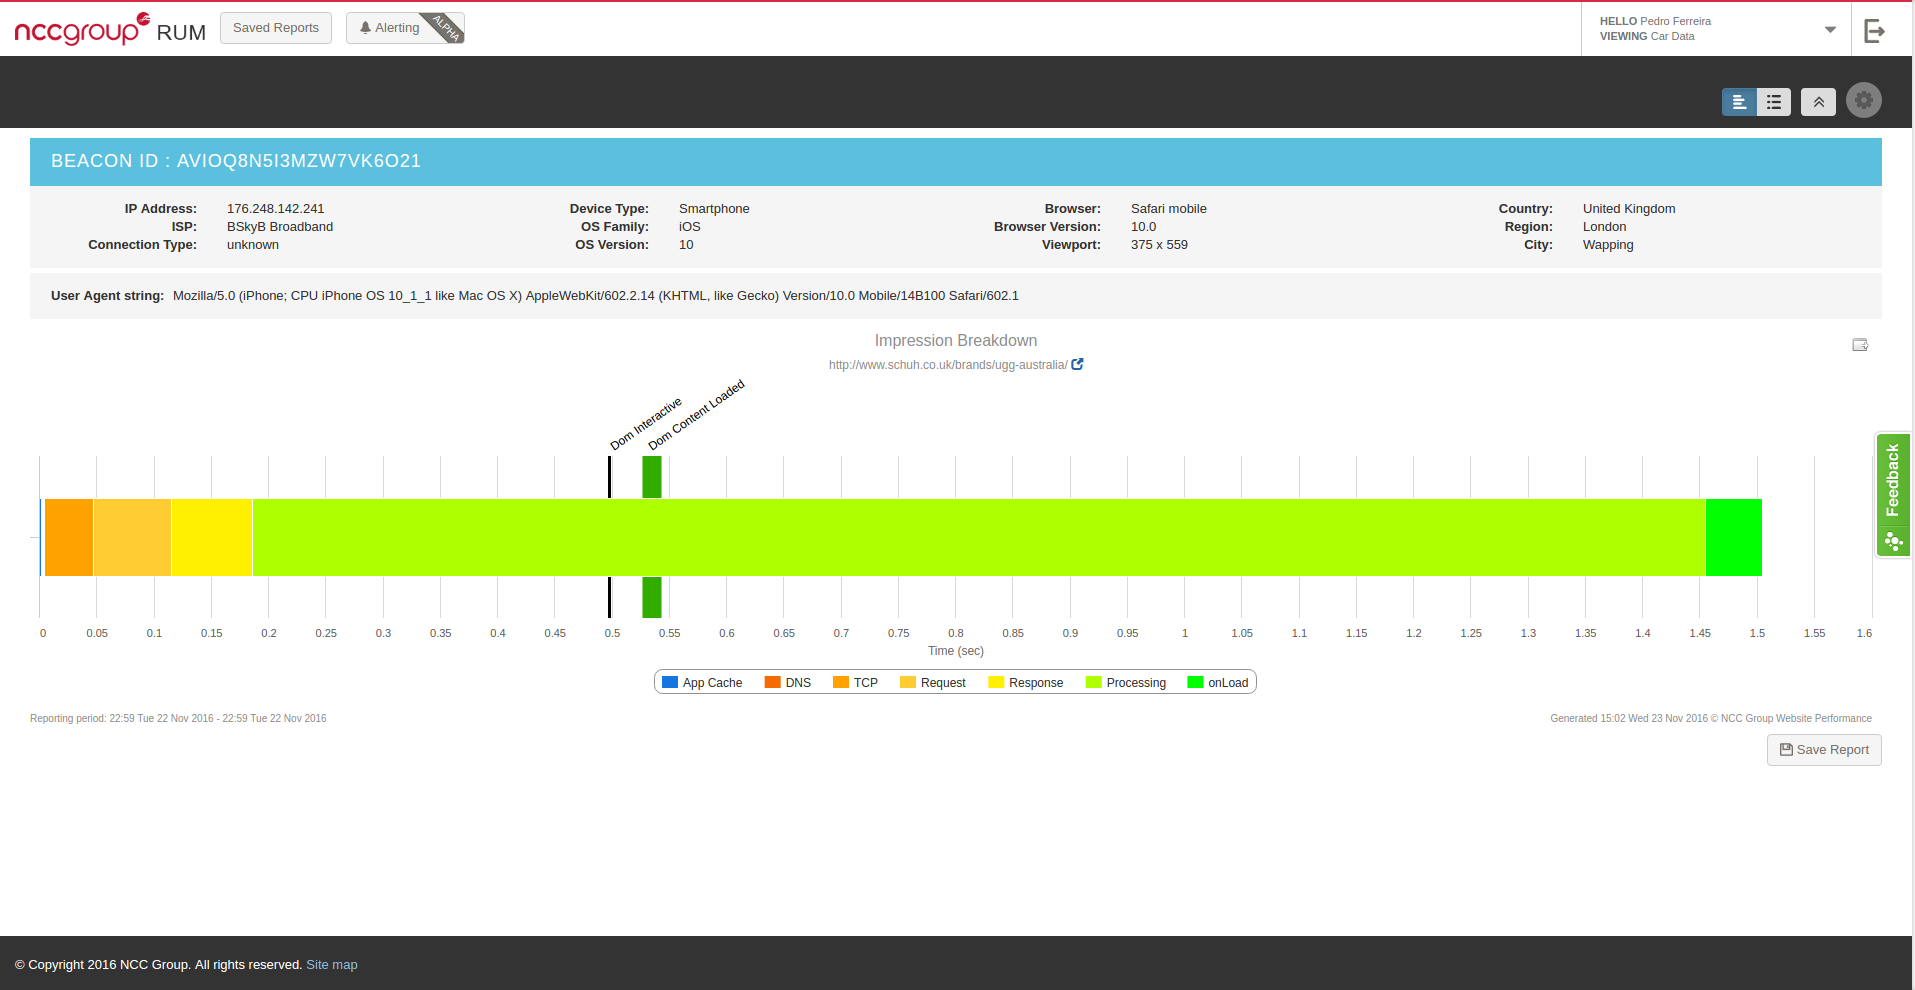
- Beacon Capturing – This is the step of capturing the beacon sent by any visitor on the website
- Offline processing – The process of aggregating the beacons and identifying sessions
- Admin area – Where customers are provisioned and accounts are controlled
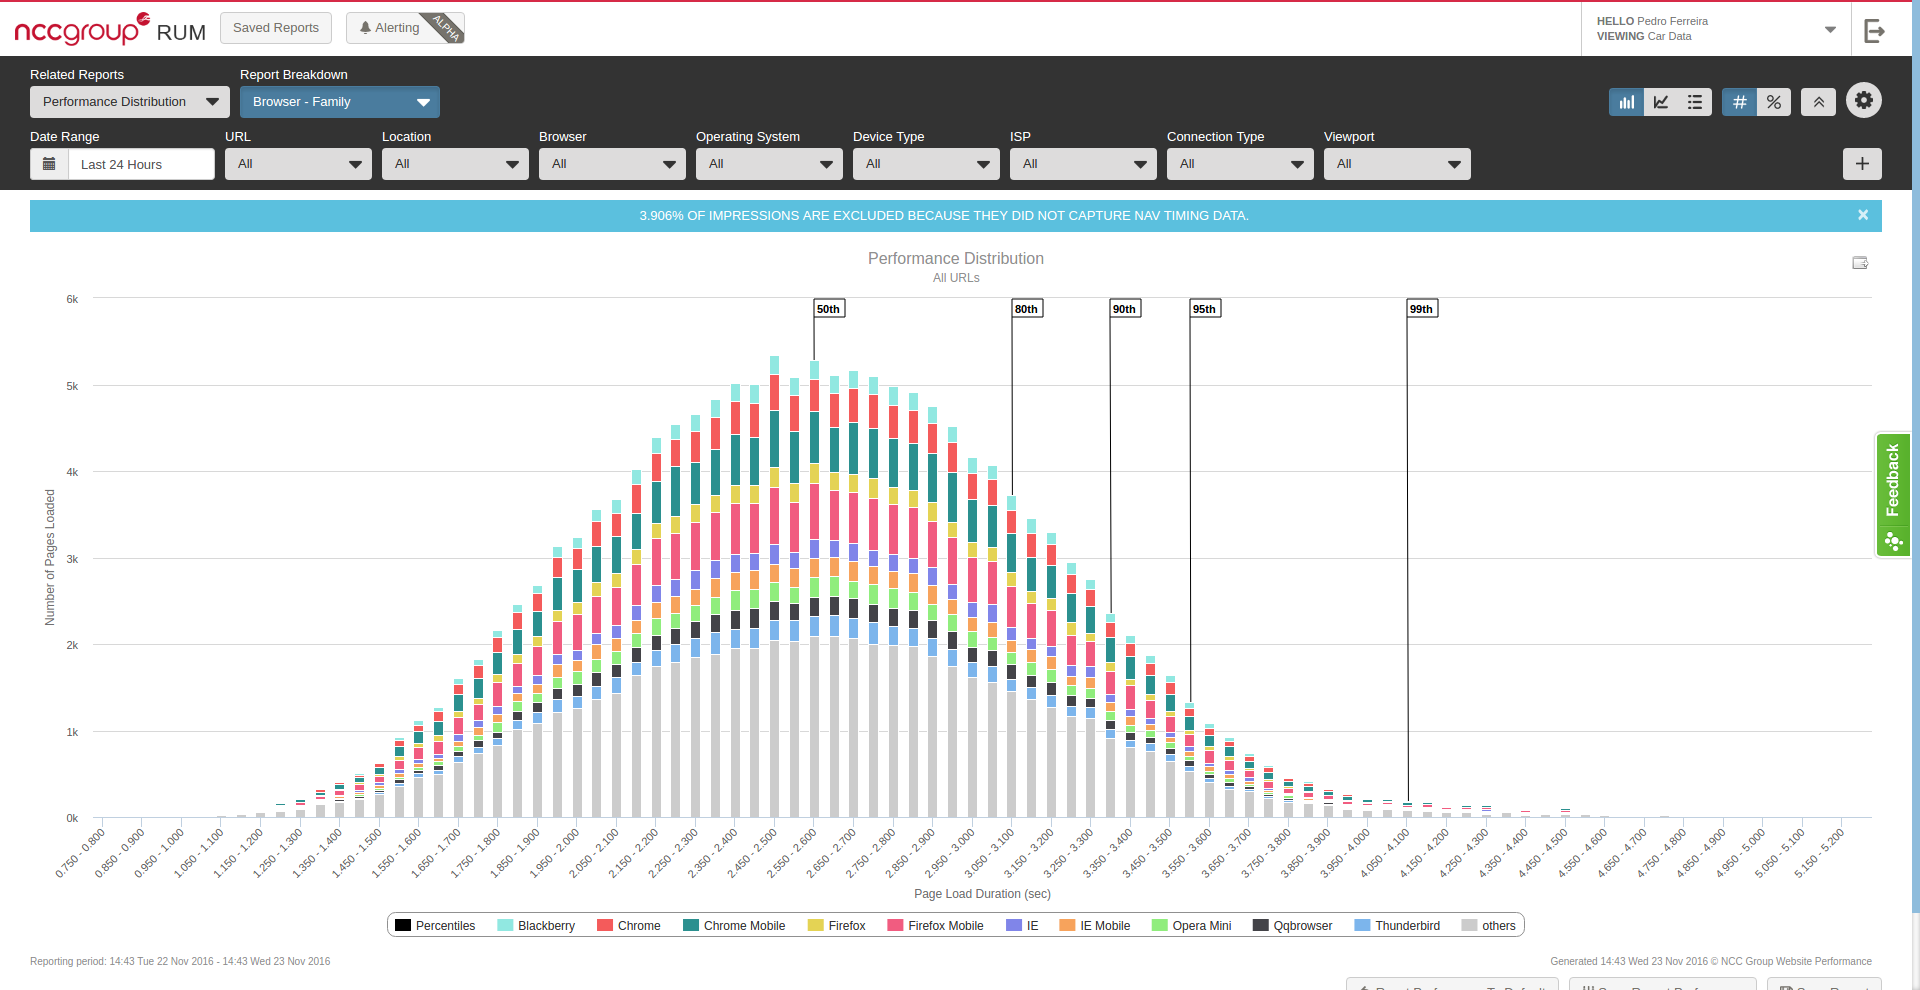
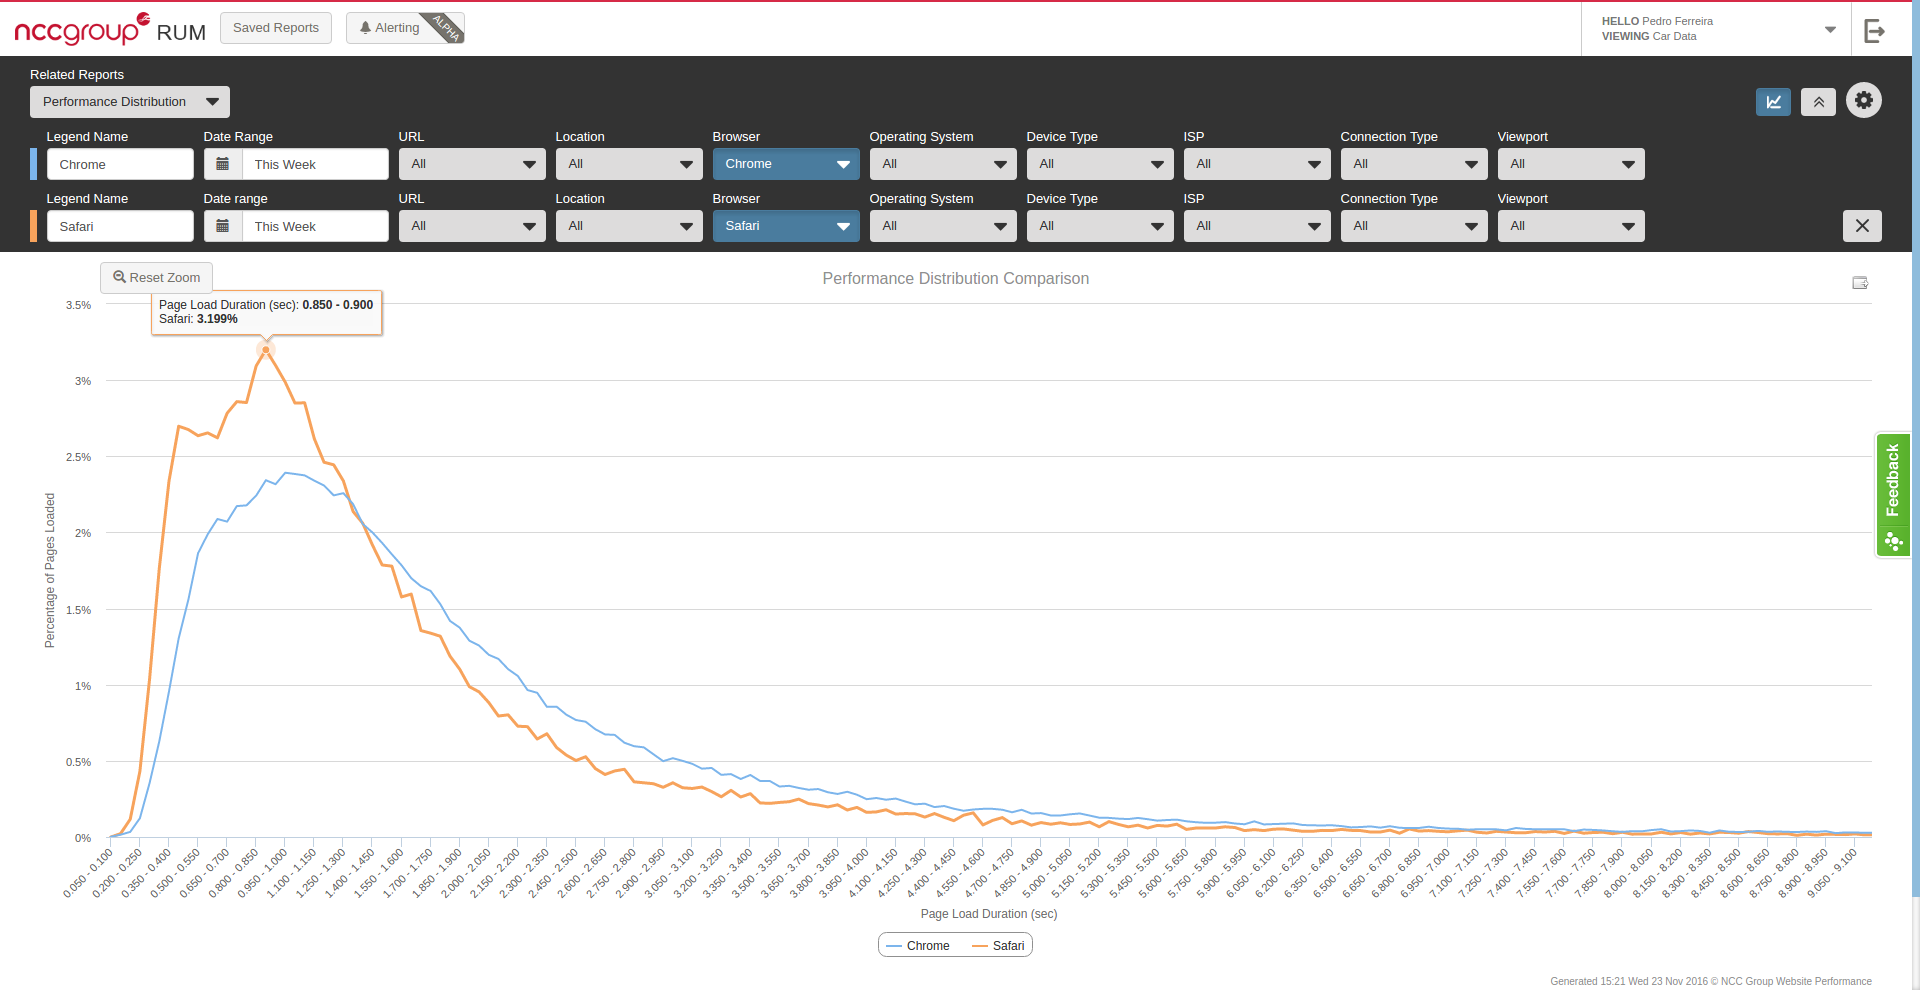
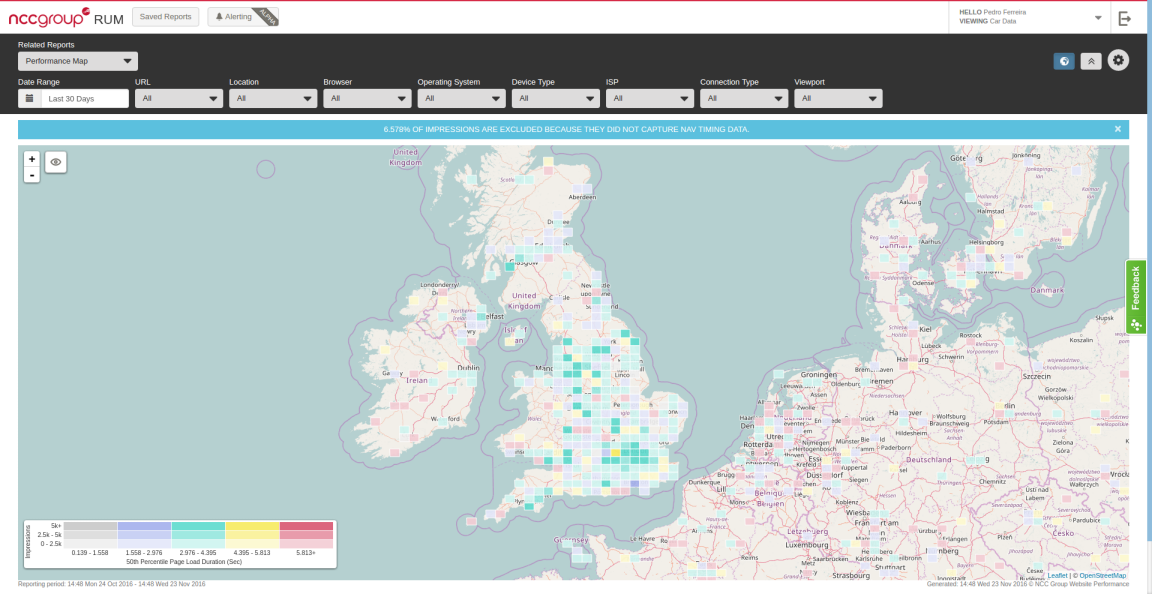
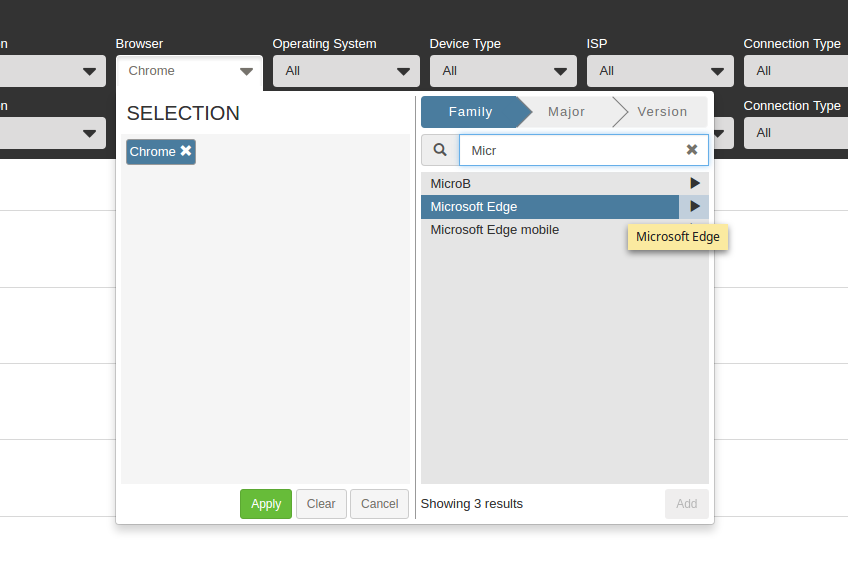
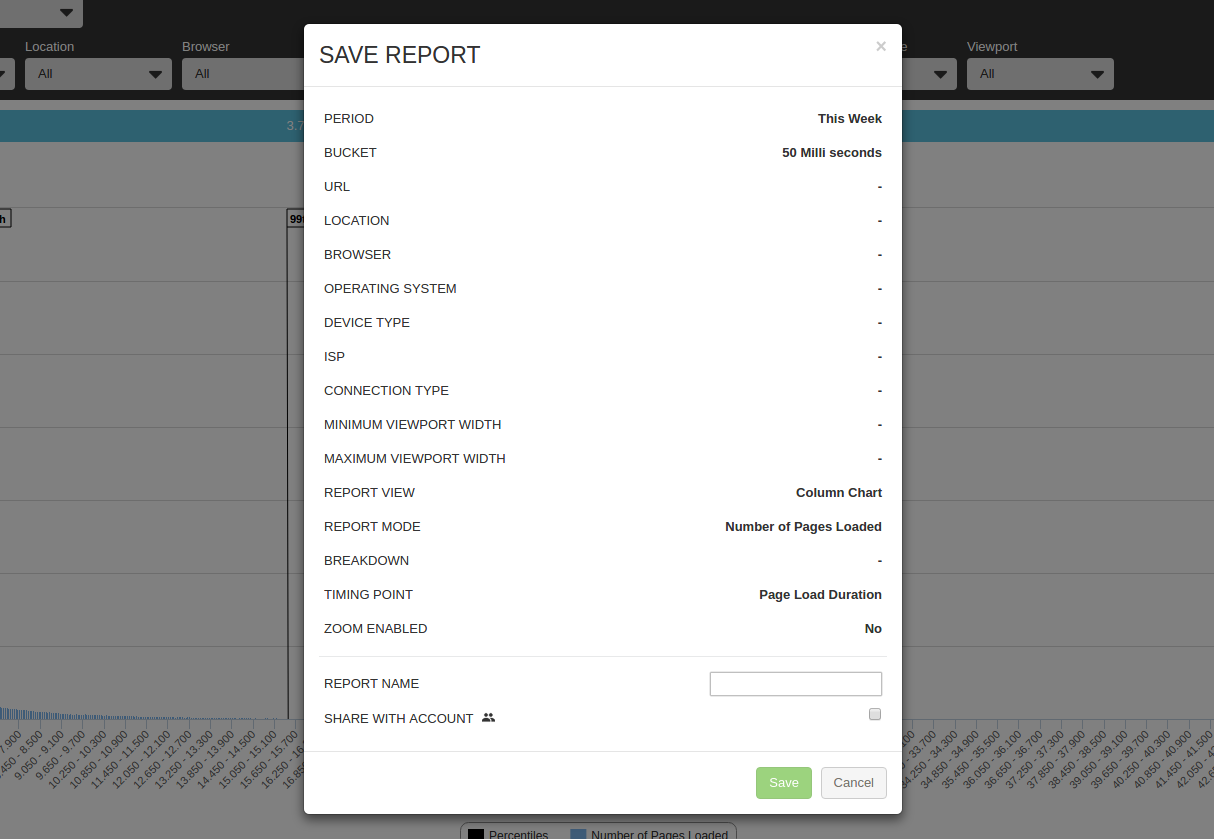
- Reporting area – The area visible for the customer and where the information is presented
I have been working in this project from November 2015 to today.
Technology Stack
Different technologies were used in the different components of the project.
For the Beacon capturing process a .NET approach using C# was chosen. This choice was mostly because of the ease in which Microsoft .NET framework allows for creating and managing threads as well as concurrency data structures.
For the offline processing a PHP Daemon approach was implemented. This would allow for easy reuse of the resources of the company which were mainly open source oriented. The work assignment was done by consuming a RabbitMQ library.
Data persistence was done using Elasticsearch, which is a NoSQL database, string search engine based on Lucene. Cluster visualisation as well as data manipulation would be done by using Kibana and Logstash.
Both the admin and reporting area were built on a Restful API Phalcon MVC framework, with an Angular JS frontend. This frontend would also make use of Bootstrap, Grunt as a task runner and a local repository of Bower is used for allowing component sharing amongst projects.
A lot of emphasis was given in testing for this project. That means that tools like jMeter and PHPUnit is used for the API, NUnit and Specflow for the beacon capturing process and finally Cucumber and Protractor for the frontend.